-
- Open tableau workbook
- Open a new sheet in the tableau.
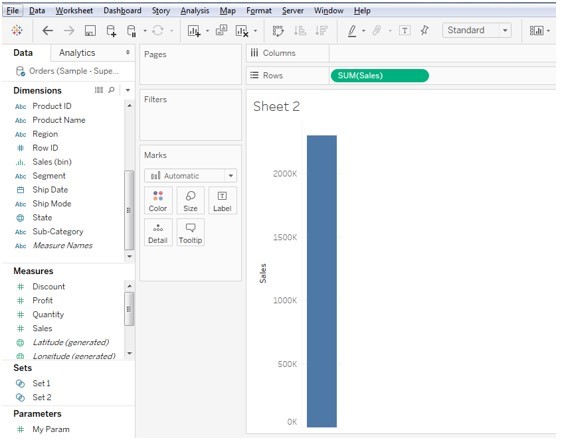
- Drag the Sales into the rows and by default, it takes the sum of sales.

-
- Drag the time dimension into the columns.
- Change the date dimension to Monthly wise by clicking the down arrow button of the date dimension and select month and year on the columns pane.

-
- Now the chart shows the sales from the starting month to the latest month of data available in the database.
- Go to the marks pane and select the chat as line chart.
- In order to get the motion chart, drag the date dimension from the dimension pane to the Pages pane.

-
- Make the date dimension to the monthly wise data as we did for the date dimension in the columns pane.
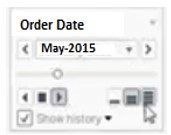
- After adding the date dimension on the Pages pane we able to see a filter or parameter kind of box on the right side bottom of the show my pane.
- This will help us in playing forward and backward of the motion of the sales accordingly based on the action we choose.
- We can do some settings to display the motion of the sales on the chart history to visible on the chart.
- Click on show history checkbox, click on the down arrow button:
- Click on the show history for all.
- Click on the both for the marks and trials for the past sales of the date dimension.

-
- Now click on the play forward button on the right side down the pane of the Show me area.
- The cart will move from the start date (month and year) towards the last date (month and year), where we can pause using the pause button also.
- These are the steps to create the tableau motion chart.


