The filters can be applied in a worksheet to restrict the number of records present in a dataset. Tableau provides the ability to filter individual views or even entire data sources on dimensions, measures, or sets.
Filtering is the way of expelling certain esteems or scope of qualities from an outcome set.
The different types of filters used in Tableau are given below.
-
-
- Extract Filters
- Data Source Filters
- Context Filters
- Dimension Filters
- Measure Filters
-
Extract Filters:
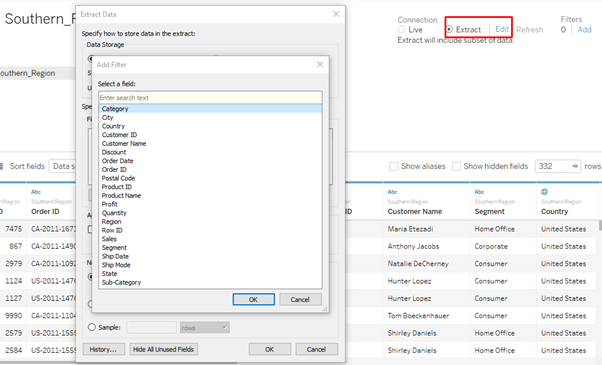
Extract filters are used to filter the extracted data from data source. This filter is utilized only if the user extracts the data from data source.
When you’re loading in your data you can choose to extract it, saving a snapshot of how it looks in your workbook and ultimately reducing the number of times Tableau queries the data source. To further reduce the size of the data going into Tableau, you can apply filters to the extract, which can be either by a certain dimension or measurement.
Data Source Filter:
A data source filter is used to filter the data in data source level. It can restrict the records present in the data set. Data Source Filters reduce the amount of data being fed into Tableau and restrict what data the viewer sees. One thing that is important to note is that, Extract and Data Source Filters are not linked. So, if you change back to a live connection your Data Source Filters will still be intact.
Example: Selecting only one-year worth of data from few years of historic data after connecting with the source.

Context Filter:
Context Filter helps to pass the criteria of the filter from one level to other related level.
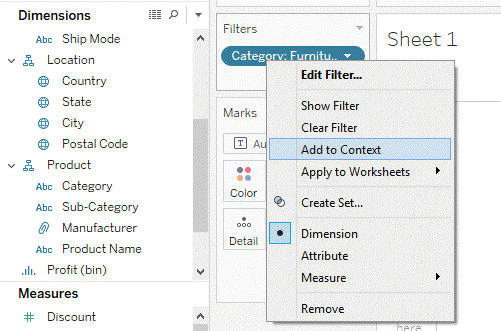
Context filter is an independent filter that can create a separate dataset out of the original data set and compute the selections made in the worksheet. One or more categorical filter that separates the dataset into major parts can be used as a context filter.
Example: Top 10 Customers in country by their purchases, here the context is ‘Top 10’. We can pass this context to know ‘Top 10’ Customers by Purchases in a State within the same country.
You may create a context filter to:
-
- Improve performance – If you set a lot of filters or have a large data source, the queries can be slow. You can set one or more context filters to improve performance.
- Create a dependent numerical or top N filter – You can set a context filter to include only the data of interest, and then set a numerical or a top N filter.
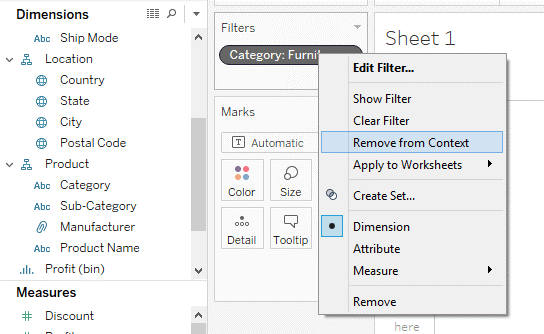
Any context filter can be changed back to normal filter by selecting the “Remove from Context” option which is available when right-clicking on the dimension. The colour of dimension box will also change back to blue color as an indication.
Dimension Filters:
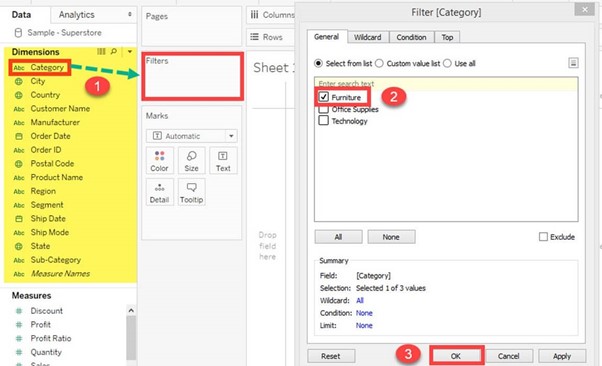
When a dimension is used to filter the data in a worksheet, it is called as Dimension filter.
These are applied by both dragging them on the Filters pane or right-clicking on the specific dimension and selecting Show Filter.
It is a non-aggregated filter where a dimension, group, sets and bin can be added. A dimension filter can be applied through the top or bottom conditions, wildcard match and formula.
Example: Filter on Order Date then selecting sales through dimension.
Measure Filter:
A measure filter can filter the data based on the values present in a measure. The aggregated measure values can be used in measure filter to modify the data.
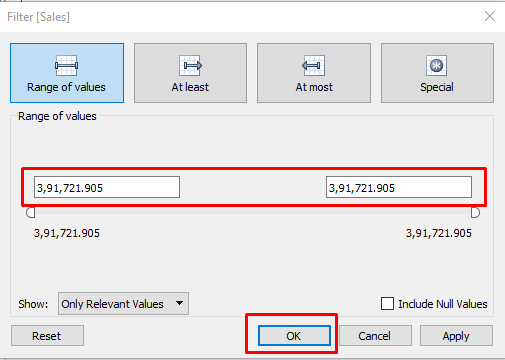
This filter provides options – range of values, at least, at most and special. We can select any option that helps to select the right data or eliminate the unwanted data. Special option is to deal with Null values.
Example: Filter on Sum of Sales.
A measure filter can be applied in a worksheet by following the procedure.
Step 1) Go to a Worksheet
-
- Select a measure present in the Measures tab. In this example, ‘Sales’ is selected. Drag the measure into ‘Filter’ box.
- It opens a ‘Filter field’ window. Select any of the aggregation from the list. In this example, Sum is taken as aggregation type.
- Click on ‘Next’ button.
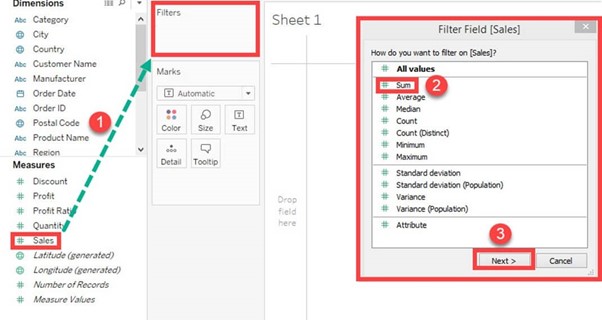
Step 2) It opens a window where you need to select the range of values. The other types of options present in the window are given as follows.
|
Range of values |
Minimum and maximum range of measure value can be given and filtered. |
|
At least |
A minimum value of a measure is given to filter the data. |
|
At most |
A maximum value of a measure is given to filter the data. |
|
Special |
An option to select null or non-null values and filter the data. |
Step 3) Select the range of values. You can modify the upper and lower limit for the range of values. And then click on OK.
